Cherry Blossoms & Solar Cycles: Predicting Peak Bloom Years in Advance
 The coordinated appearance of Cherry blossoms is an icon of spring. Might their riot of color not only be an indicator of increasing spring sunshine, but of how the sun affects us in subtle unseen ways!?
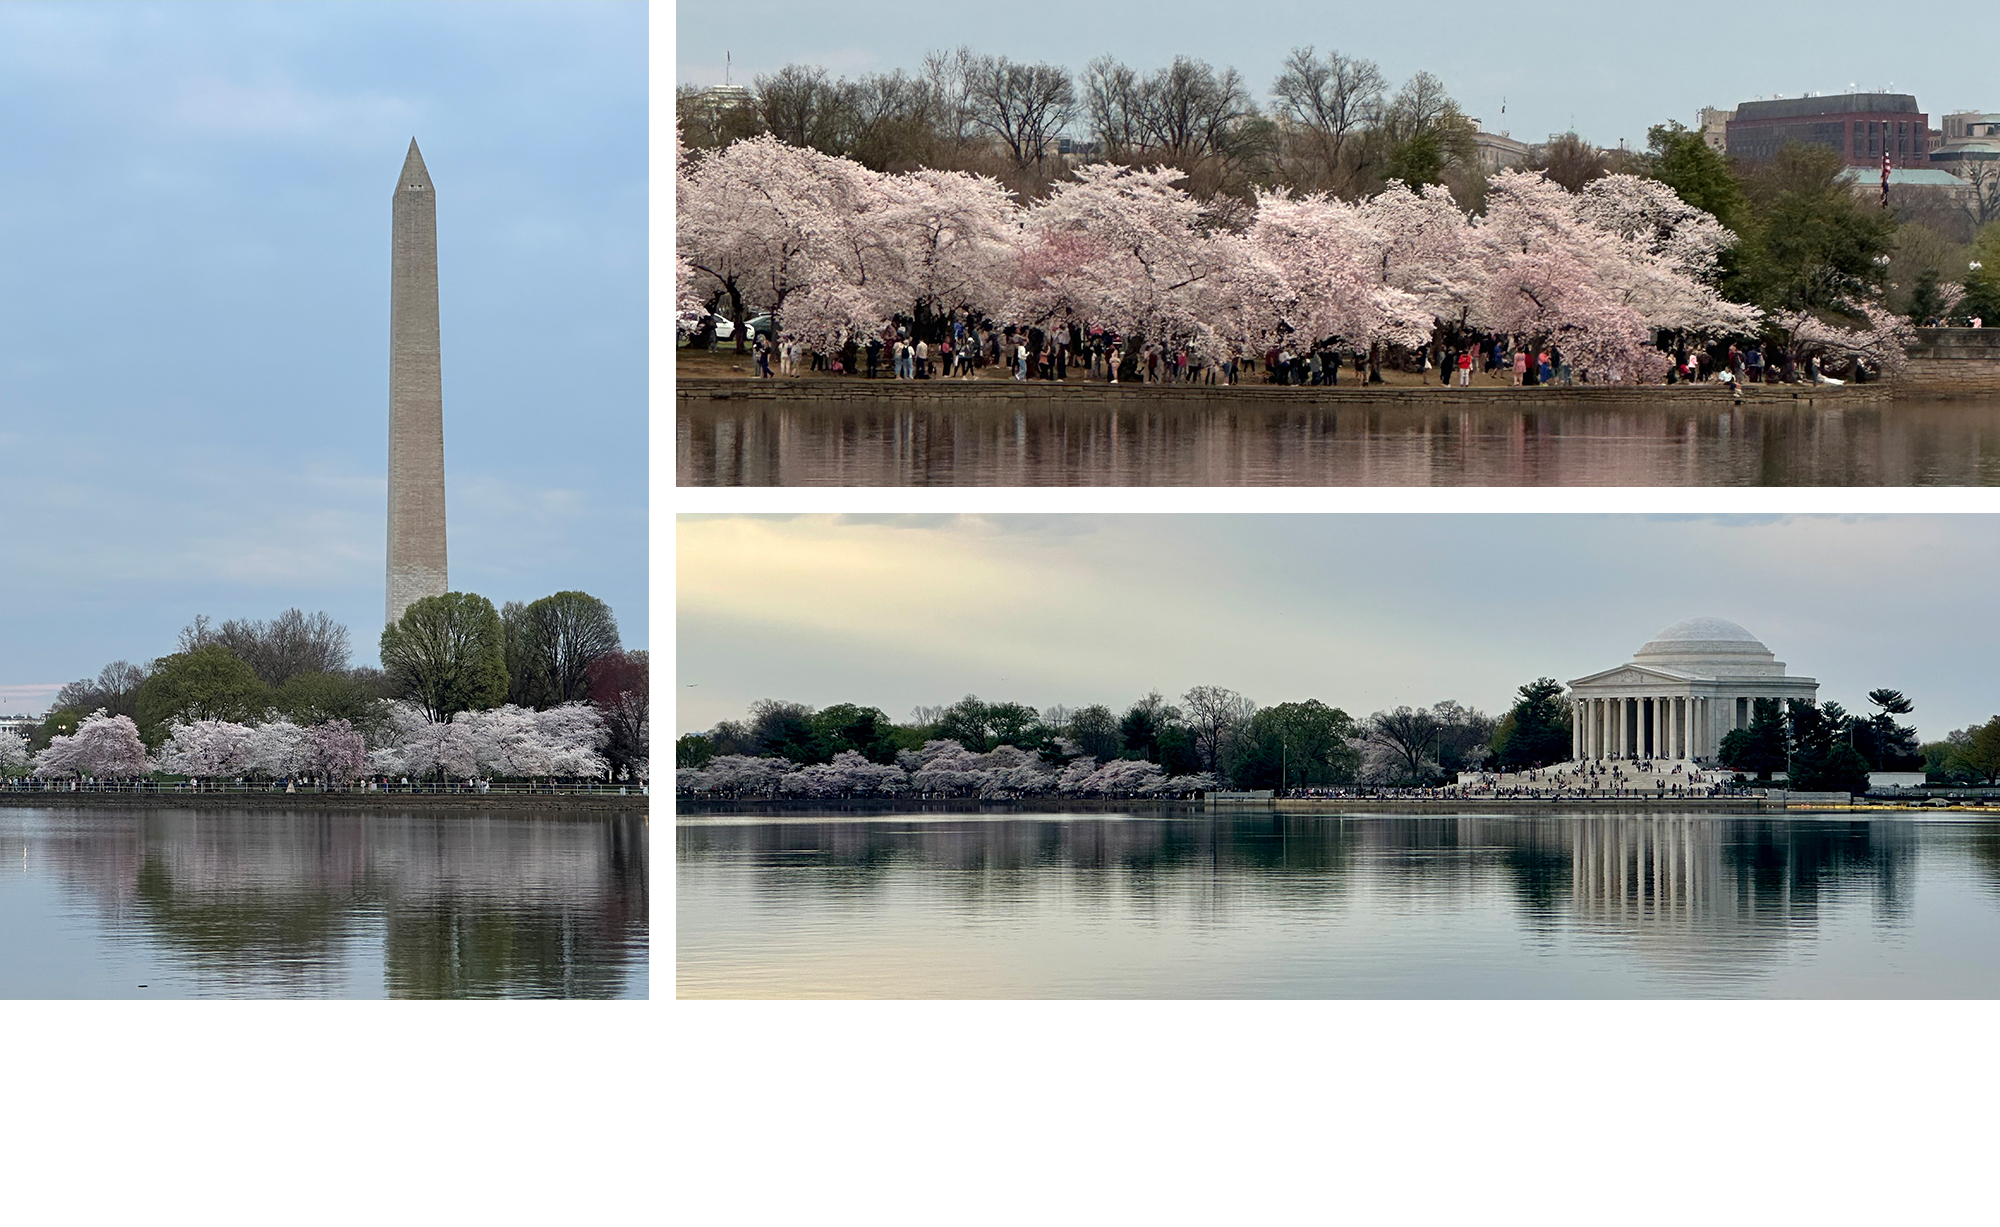
The National Cherry Blossom Festival is “Washington’s Grandest Springtime Tradition” and draws over 1.5 million visitors annually.
Washington, D.C. has had cherry blossoms since 1912, when Japan gifted the U.S. about 3,000 trees. The “peak bloom” refers to the day when 70% of the blossoms are fully open, a moment eagerly anticipated by meteorologists, city planners, the National Park Service, residents, and tourists. Peak bloom timing varies each year, influenced by winter and early spring temperatures, as plants are sensitive to local environmental cues.
“How much is it worth to the District to accurately predict peak bloom two, three, four years out?”
“You heard it here first! We’re predicting #CherryBlossom Peak Bloom to fall between March 28-31 this year.”
So said the National Park Service in a post (tweet) on X making their announcement on Thursday February 27 (https://x.com/NationalMallNPS/status/1895154004063330645).
The NPS makes the Official Prediction, and they nailed it – from 4 weeks out. Peak Bloom was called March 28. Metro recorded record ridership over the weekend, and traffic cameras on the I395 bridge showed backups extending miles, past the Pentagon. (I went down at dawn Saturday, and around the Tidal Basin was packed even that early!)
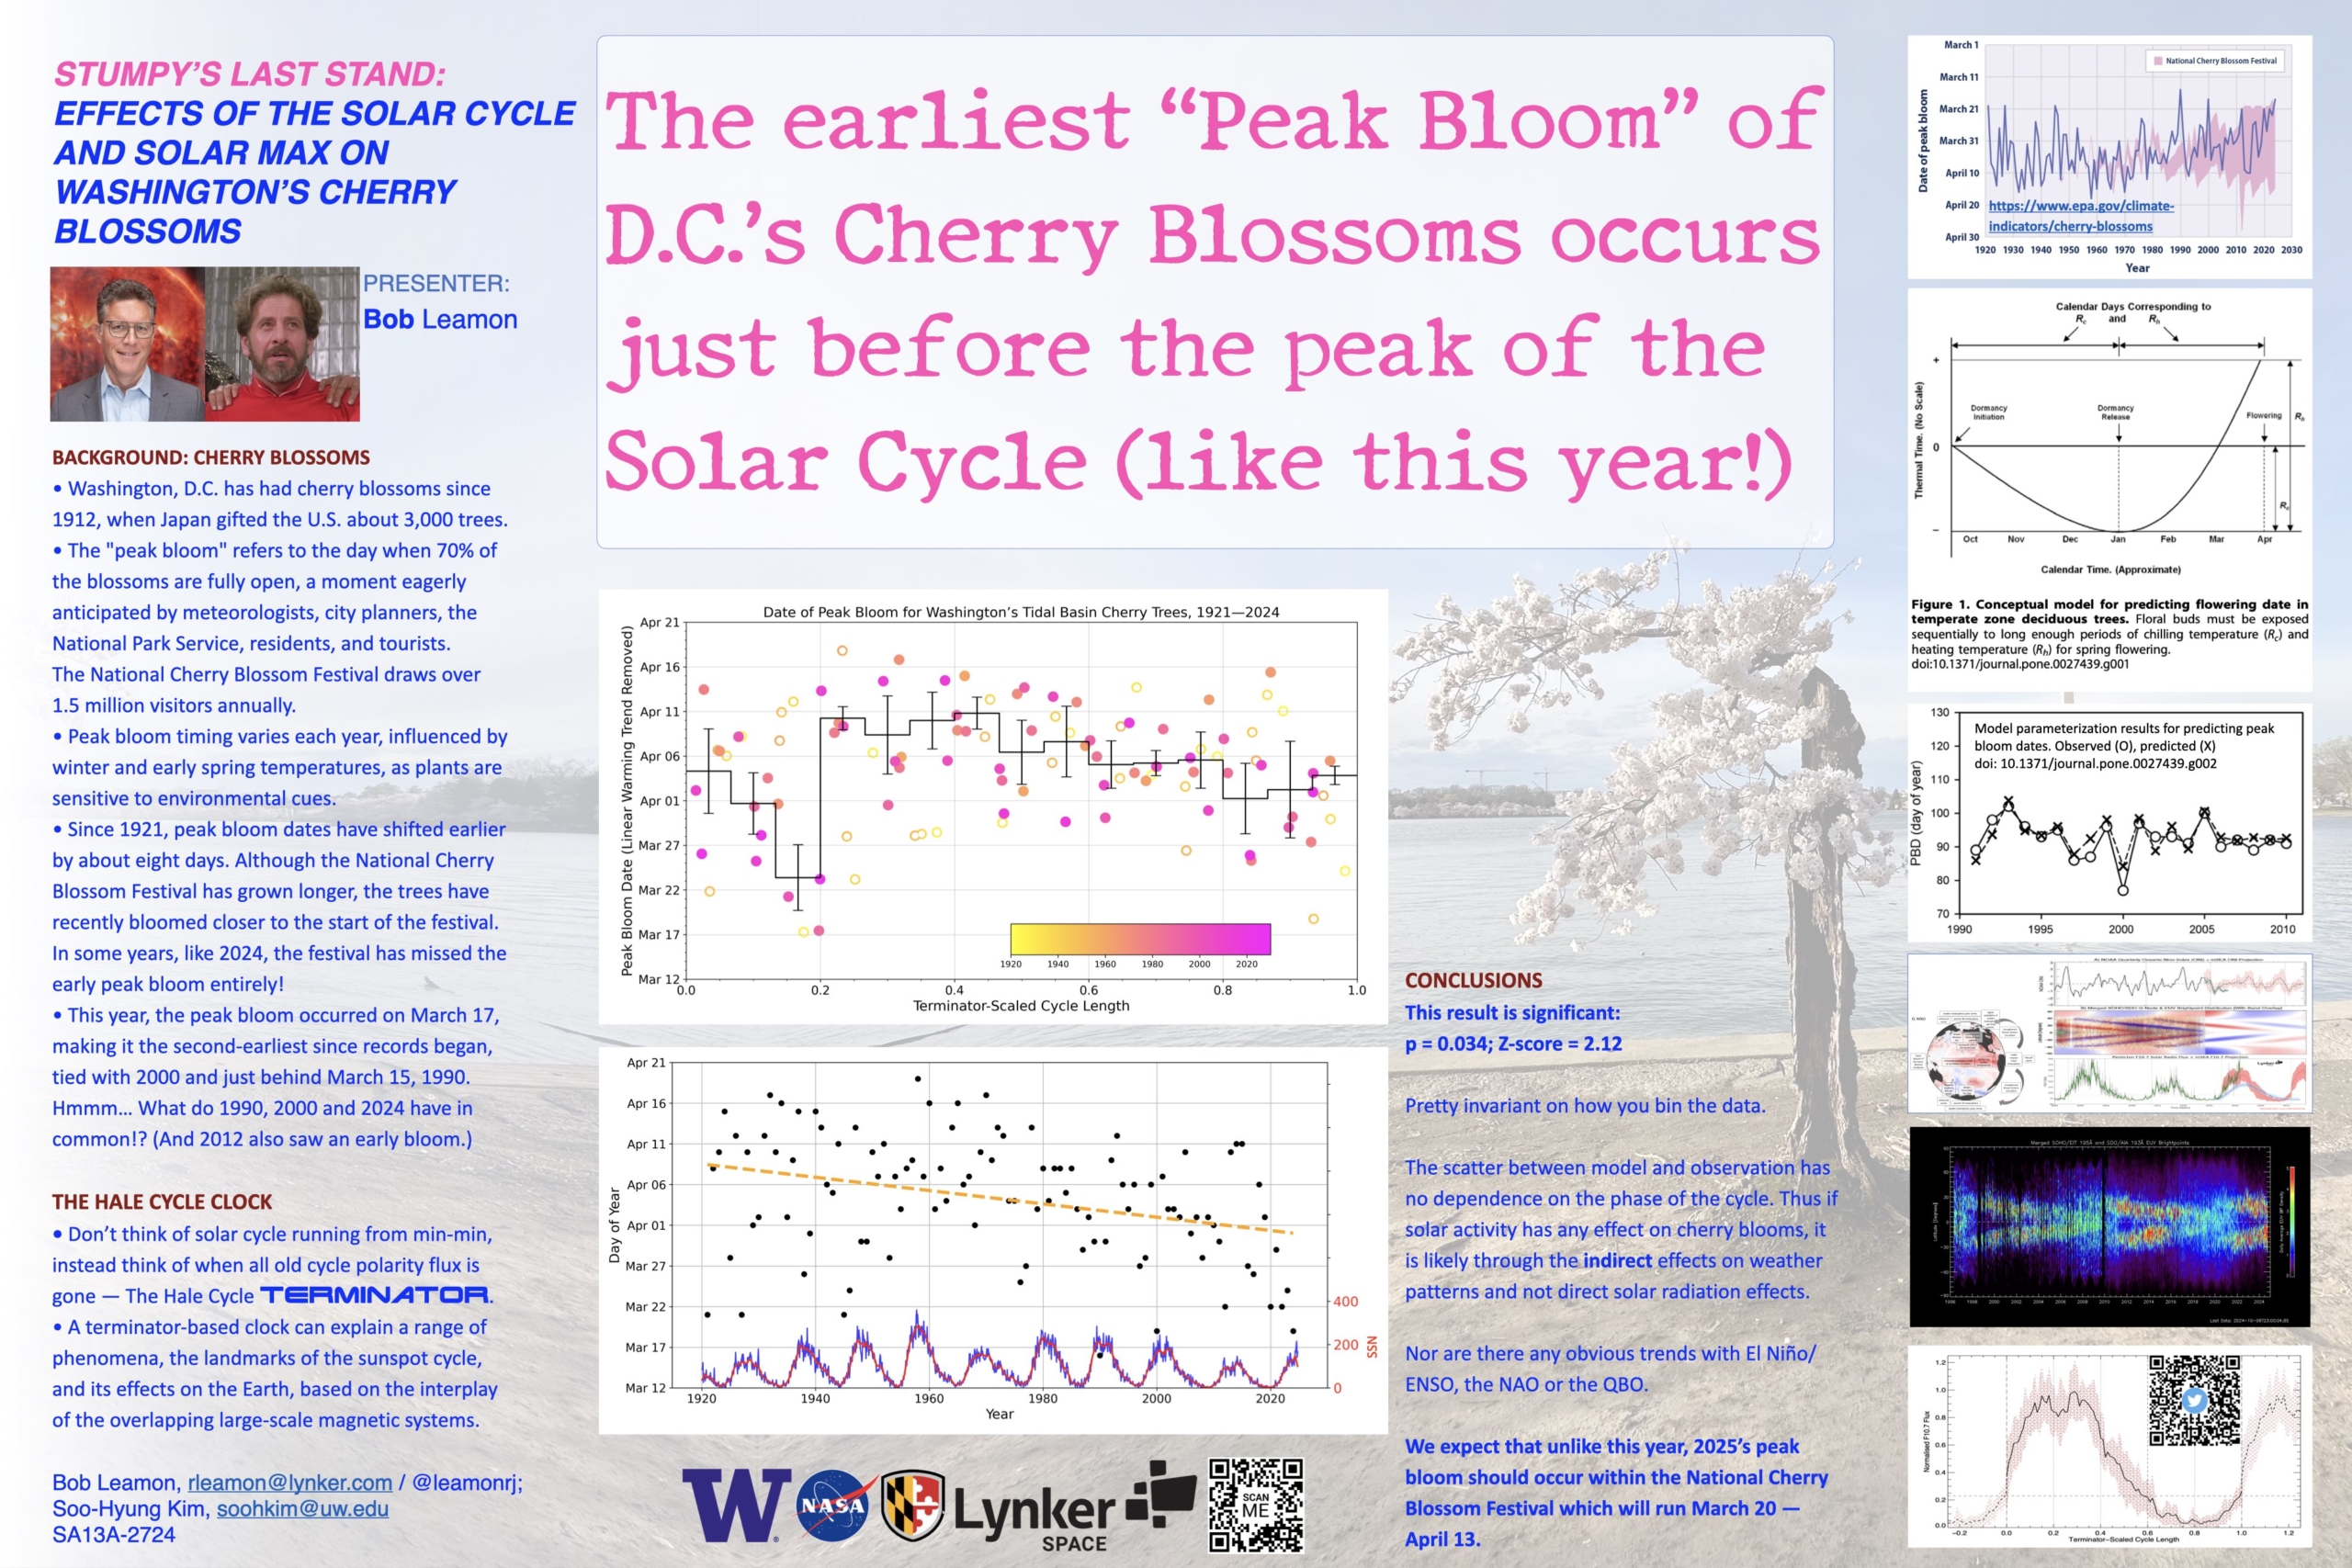
But what if I said that April 1 LAST YEAR, we made the prediction of April 1-3, 2025, because of 2024’s super early peak bloom, and the discovery of a relationship between earlier and later Peak Blooms and the Sun’s roughly 11-year activity cycle…!
Last March’s Peak Bloom was super early (March 17, tied with 2000 for 2nd earliest since records began, behind only March 15, 1990), and even preceded the official start of the National Cherry Blossom Festival and its events and activities.
What do all those years have in common? They’re all just before “Solar Max,” the peak of the solar cycle. Even though 2012 “only” had its Peak Bloom on March 22, it was also relatively early, compared to the rest of the (relatively weak) previous Solar Cycle that peaked back then.
The second part of the predictions is that in the following year or two, after solar max, it’s far more likely that the peak bloom will be relatively late. (Phew!?)
“How much is it worth to the District to accurately predict peak bloom two, three, four years out?”
The increasing urbanization of the DMV and the associated “heat island effect” likely has more of an influence on Washington’s Peak Bloom than more global climate changes, but the Peak Bloom date has been getting earlier and earlier – about 8 days over the century of recorded measurements, but accelerating over the last 25-30 years. (The same is true for the Imperial Palace in Japan, which has kept Cherry Blossom records since 812 AD!)
We don’t have a definitive mechanism yet, but our leading hypothesis is from a series of scientific papers from the 1970s (by Walter O. Roberts, the founding director of NCAR’s High Altitude Observatory in Boulder, CO) that tie the changing number of geomagnetic storms in winter months nudging the tracks of winter storms that sweep in from Siberia and Arctic Canada, leading to more unsettled and cooler weather in and around Washington DC.
Having been a resident of DC since 2004, I can vouch for the fluctuations in winter severity and temperatures throughout the solar activity cycle. And it was fun to present work about my adopted hometown and its iconic blooms at December’s American Geophysical Union conference here in Washington.
Finally, it was announced this week that as a symbol of friendship, Japan is gifting Washington, DC, with 250 more cherry blossom trees to celebrate the 250th anniversary of America’s founding.
(https://x.com/JapanEmbDC/status/1906827807558078967)
Regardless of when temperatures get warm enough for those new trees’ Peak Bloom in the coming years, they will get warm enough, and there will be a riot of pink flowers in and around the Tidal Basin and the District for residents and visitors alike to get out and enjoy!
Bob Leamon is Lynker’s Lead Space Weather Scientist.
This was a fun little interlude, but our bread and butter at Lynker Space is understanding how the sun works and the impacts of space weather. If you are an operator in low earth orbit or on the ground, including commercial crop plantings, and were breathing a sigh of relief that ‘solar max’ had passed, then think again! Are you sure that you won’t be affected by a doubling of the space weather effects on your systems? If you need some assurance, drop us an email at info@lynker-space.com, find us on X @LynkerSpace, or on LinkedIn. We can help you understand what is going on and how our unparalleled insight can help protect your systems.
Solar Max was SO Yesterday: We’re Entering The Space Weather Battle Zone
Over the last few weeks news and social media channels have been heralding the arrival of solar maximum, or “Solar Max”. Our friends and colleagues at NASA and NOAA have been watching intently, and so have we at Lynker Space. Solar Max is a phase of the Sun’s roughly 11-year activity cycle that persists for a couple of years and is marked by a peak in the number of dark spots on the Sun–but that’s not the whole story!
Twice in the past several months, in May and then again in October, many of us witnessed magnificent and very energetic geomagnetic storms that produced aurora at unusually low latitudes. These events also disrupted critical technologies on the ground and in space, but you may not have heard much about that unless you are an ‘operator’.
We fully anticipate that the next couple of years will see an increase in such disruptions. That’s because geomagnetic activity, measured using an index measuring the magnetic field at stations dotted around the Earth (the ‘Ap’ Index), typically peaks a year or two after the sunspot peak.
The later peak in geomagnetic activity is all due to something called the Hale Cycle! The Lynker Space team uniquely tracks and studies the Sun’s Hale Cycle to produce its high-skill forecast of solar activity.

Our team has been tracking the Hale Cycle and its relationship to the sunspot cycle for over a decade; we produced the infographic above to illustrate the evolution of both. The magnetic bands of the next Hale Cycle first appear around Solar Max in each hemisphere and slowly travel to the equator over the next 17 to 19 years. Every 11-ish years a new, oppositely polarized set of bands appear around 55 degrees latitude and start to travel to the equator as well — we don’t quite know why. In the graphic, the magnetic bands are colored in red and blue to signify their polarization.
This all means that – most of the time — there are two Hale Cycles influencing solar activity. The only time this is not the case is for a short time as the sunspot cycle is ramping up, known as the ‘ascending phase’. At that time there is only one Hale Cycle present. The ascending phase follows an event that we call the ‘terminator,’ which happens at the very end of a Hale Cycle’s journey to the Sun’s equator. The last terminator event, that of Solar Cycle 24, occurred in December 2021.
In the ‘declining phase’ of the sunspot cycle – following the peak in sunspots – there are two competing Hale cycles. We are entering EXACTLY this phase of activity and the sources of energetic space weather will increase as a result! From the plot above you can see that the green trace in the top panel — the monthly average of the Ap index – peaks a couple of years after the sunspot maximum shown in the middle panel. Indeed, we can also see that the geomagnetic activity NOW is the same as that during the peak of geomagnetic activity in 2015. We anticipate that in the next couple of years it will grow to reach the values in 2004, a Hale Cycle ago, and 30-50% larger than present.
Why? This competition between Hale Cycles after sunspot maximum produces a ‘battle zone’ where solar active regions get more complicated AND we see a darker side of space weather – that from “coronal holes” – re-establishing itself (remember that all of this behavior is cyclical). Coronal Holes came about their name in the 1970s when images of the Sun’s corona taken from space (by instruments on Skylab, the first space station) showed dark hole-like features as a stark contrast to the sunspot-rooted active regions which are bright in the corona. Not long after it was discovered that these regions were the source of very fast solar wind streams. The solar wind is a stream of energetic particles that continuously “boils off” the sun to fill the solar system. The fastest wind streams travel outward from the Sun at whopping speeds between 500 and 700 km/s (that’s 1.2 – 1.5 million mph!) and can also impact satellites and other technologies.
The image above shows the solar corona last week (Nov. 6, 2024) as seen by a telescope on the Solar Dynamics Observatory. Coronal holes (dark areas) and active regions (bright and shiny areas) are easily identified. As a side bar, we have been tracking the pair of large coronal holes near the central meridian (one toward the north pole and one toward the south pole) since March 2024 (see image below), not just because of the space weather threat they pose but also for a very different reason — they are indications of the emerging space weather battle zone and what will become Sunspot Cycle 26 in the next decade! Did I say we were good at this?

So, cutting a LONG story VERY short, we are now in a period where more sources of disruptive geomagnetic activity can penetrate Earth’s magnetosphere. These conditions will persist through 2024 and well into 2026-27 before dying down as we begin the decline to sunspot minimum – when coronal holes and their fast solar wind will be the primary drivers of space weather. That is, until the next terminator event and Sunspot Cycle 26 springs to life!!
If you are an operator in low earth orbit or on the ground and were breathing a sigh of relief that ‘solar max’ had passed, then think again! Are you sure that you won’t be affected by a doubling of the space weather effects on your systems? If you need some assurance, drop us an email at info@lynker-space.com, find us on X @LynkerSpace, or on LinkedIn. We can help you understand what is going on and how our unparalleled insight can help protect your systems.
Lynker Space Unveils New Operational Space Weather Forecasting Capability
Lynker Space is transforming space weather forecasting with new technology to predict and mitigate space weather threats to numerous industries and critical services. The effort is led by Scott McIntosh, who joins Lynker as Vice President of Space Operations.